Fasten your seat-belts, because this is going to be one long ride.
Tesla’s path to profitability does not run through Wall Street. It relies on two factors, how fast their ramp is and how they contain Operating Expense growth.
Tesla’s Operating Expense Growth is Declining
In the first quarter of 2018, Tesla reported operating expense of $1.053 billion, compared to $925 million in 2017, a growth of 13.83%. The slowest expansion since the first quarter of 2013. In the first quarter of 2018, Tesla reported production of 34,494 Model S/3/X, which is a lot more than what the company built in Q1-2013.
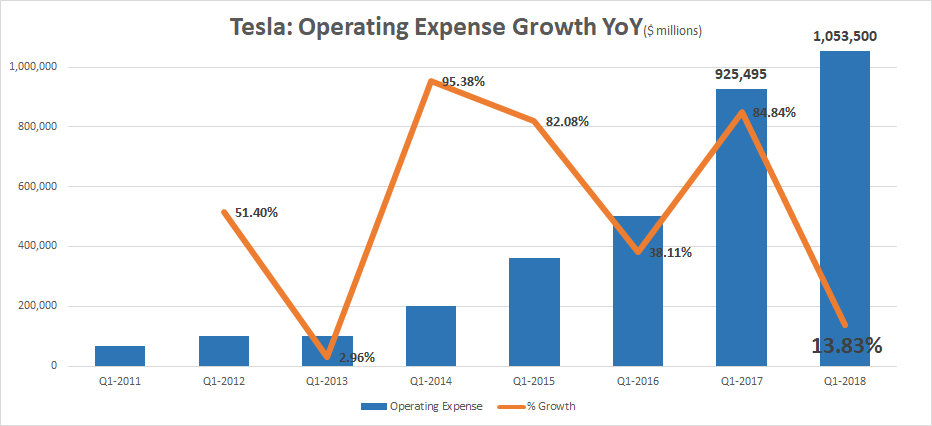
Tesla’s operating expense increased by a whopping 84.84% in Q1-2017, thanks to the acquisition of SolarCity.
Tesla reported an increase of $44.8 million in R&D and $136.6 million in SG&A due to SolarCity acquisition and there was also a one time hit of $67 million related to SolarCity and Grohmann acquisition. If we exclude these items, operating expense grew only by 35% between Q1-2017 and Q1-2016.
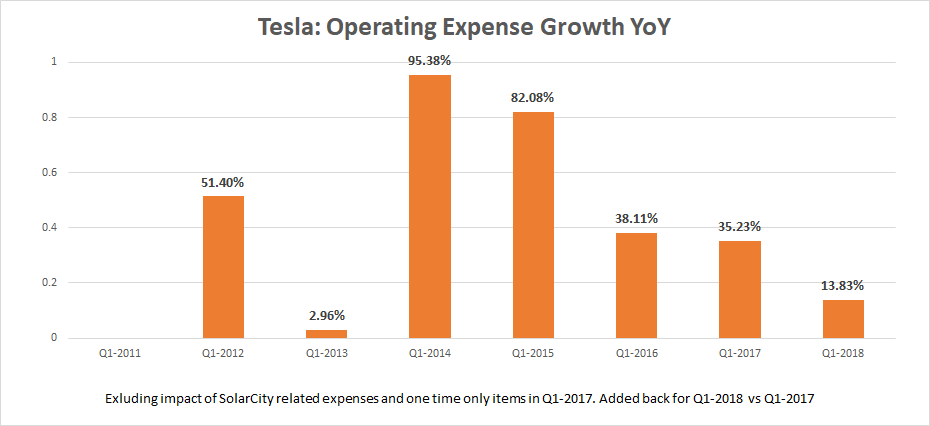
The pace of Tesla’s operating expense growth has been declining at an alarming(!) rate -from 95% in the first quarter of 2014 to 14% in the first quarter of 2018.
Operating expense increased from $199.09 million in Q1-2014 to $1,053 million in Q1-2018. Rate of growth has been coming down as dollar value of operating expense kept getting bigger and bigger. Advantage Size.
“Research and development expense increased by $139.6 million, or 76%, in the three months ended March 31, 2017 as compared to the three months ended March 31, 2016. This was primarily due to the inclusion of research and development expenses from SolarCity of $44.8 million”
“Selling, general and administrative expense increased by $285.3 million, or 90%, in the three months ended March 31, 2017 as compared to the three months
ended March 31, 2016. This was primarily due to the inclusion of selling, general and administrative expenses from SolarCity of $136.6 million”
“Total Q1 operating expenses increased sequentially as the period now reflects a full quarter of SolarCity operating expenses, and due to $67 million of non-recurring charges related to the SolarCity and Grohmann acquisitions and the end of our work for Daimler”
From Tesla Q1-2017 Earnings and Shareholder Letter
Why Tesla’s Operating Expense growth will keep slowing down in the future
“Just no room at Fremont, we are bursting at the seams.” “We practically had a riot the other day for parking”
– Elon Musk
-
Tesla already has way too many employees in its rolls when compared to other auto companies.
-
Tesla nearly added 22,000 employees (exluding SolarCity) between 2012 and 2017. Annual Production has increased from +3000 in 2012 to +100K in 2017 and it may end up crossing 250K in 2018.
-
According to reports, Fremont Factory already hosts nearly 10,000 employees, way more than the 6,800 employed by GM. Elon noted last year that the factory is bursting at the seams.
-
Max Capacity planned for Gigafactory is 500k. Tesla has crossed max capacity of 7000 units per week or 364,000 units over a 52 week period. 73% Capacity
-
With Tesla this close to maxing out capacity, further hiring will be mostly in marketing and sales.
-
Cost of ramping up from max production of 0 cars per week to 6000 cars per week will never be equal to ramping up max production from 6000 cars per week to 9000 cars per week. It will be faster, easier and cheaper.
Tesla is getting closer to Economies of scale with every additional car built
Tesla never had a problem with gross margin. It is one of the healthiest numbers on Tesla’s financial statements. Operating expense has always been Tesla’s Achilles heel.
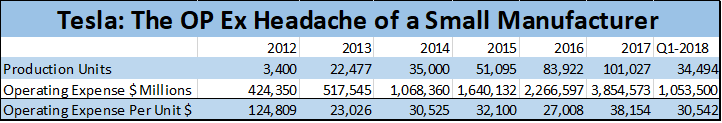
As you can see from the table above, Tesla’s Operating expense per car has hovered between $23K to $38K between 2013 and 2018. But Tesla is not building tens of thousands of cars per year anymore.
With Tesla hitting 6000+ cars per week, the company can expect production during the second half of the year to cross 160K units. Add the 87,833 cars the company built during the first half of 2018, Tesla should cross 250K units in 2018.
“Average fixed costs falls continuously because as output increases,total fixed costs are being spread over a higher level of output.”
What happens when Tesla’s Operating Expense increases by less than 15% in fiscal 2018 compared to 2017?
Tesla building 250,000 Model S/3/X this year is a highly likely scenario as they have already built 87,833 units this year and max production is near 7000 units per week.
If Operating Expense grows less than 15% in 2018 compared to 2017, a huge amount as the absolute dollar increase will be $578.186 million – Tesla’s per unit Op.Ex will plunge to $17,731.
As you can see from the table below, even 30% Op.Ex growth in 2018 will result in lowest per unit Op.Ex in Tesla’s history. An increase of more than 1.15 billion dollars.
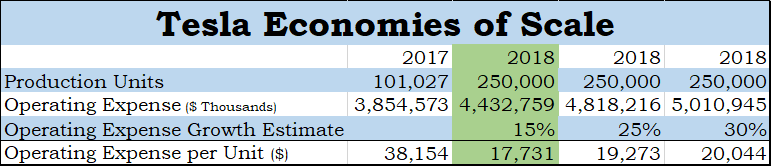
Additional estimates.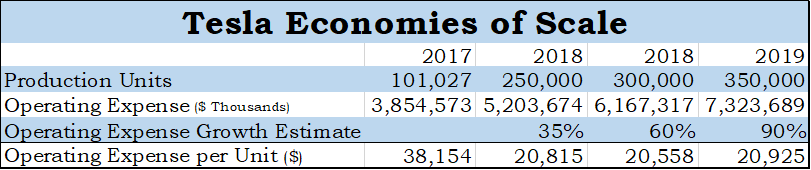
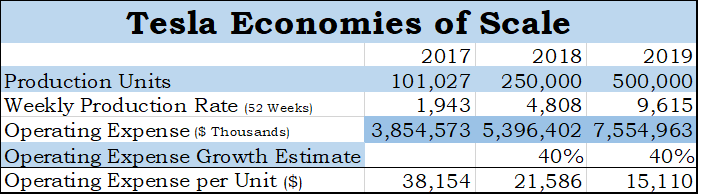
Economies of Scale: When the Worst Case Scenario becomes the Better than Yesterday Scenario
What if Tesla messes it up big time and ends up nearly doubling its operating expense in two years? Tesla can still be a profitable company by reaching 500k units annual production if it can keep its gross profit per unit above $15,110. Still the lowest per unit Op.Ex in Tesla’s history.
With multiple scenarios explained, its time to look at where Tesla Model 3 will be in the production map.
We already have two independent Model 3 Tear-downs either side of the Atlantic Ocean indicate that the Model 3 is sitting pretty with 20% to 30% gross margin.
As I noted earlier, Tesla never had any difficulty with gross margins. So lets use Tesla’s five year annual average gross margin of 24% for 2018 and 2019 and assume that Tesla caps its Op ex growth at 15% for 2018 and 2019.
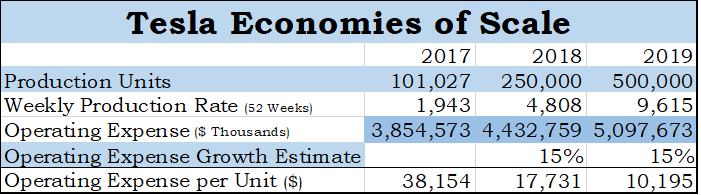
At 500k production capacity, per Unit operating expense falls to $10,000. With 24% gross margin, Tesla will break even at an (combined Model S3X) average selling price of $42,000.
Guess that’s where $35K Model 3 is. But I think Tesla should be able to bring down per unit Operating expense under $10K earlier, if they can contain Op ex growth under 15%. The lower the pace of growth is, the faster we will see $35,000 Model 3.
So where is $35,000 Model 3?
To get there Tesla needs to do the following
-
Ramp up weekly average production to 9,615 units. (already around 7k)
-
Have a stop set at less than 15% Operating Expense growth for 2018 and 2019, an increase of around $600 million each for 2018 and 2019 . (Q1 opex grew by 14%).
-
Tesla will be breaking even at an average selling price of $42K.
-
With Model S/3/X pricing mix, ASP could go north of $42K. The higher it goes, the larger Tesla’s profits. (100,000 Model S/X @ ASP of 80,000 and 400,000 Model 3 @ ASP of $45K, will yield a combined Model S/3/X ASP of 52,000)
-
Tesla waits till it reaches these goals before hitting its strides on Model Y, Semi and Giga3. They can still do R&D (future projects) as long as Op Ex does not increase by more than 15%. Wait for a few quarters, allow operating profits roll in and then balance profits with spending.
For those of you who want to forecast estimates please make a copy of this Google sheet and input your own numbers ( Link )
Note: I have excluded revenue from Energy generation, Storage, Services and other segments, while including their R&D, SG&A costs . Hope that makes my estimates conservative.
If you found this article worth your time, please do share it with your friends. And do let me know if I have made any mistake. Will update. Thanks for reading
Disclaimer: I hold no position in Tesla, do not own Tesla stock. Have no plans to initiate a position in the next 72 hours.
You can reach me at shankar.ssn@gmail.com or @ShankarsTwits
Sources:
Tesla Investor Relations: Annual Reports, Quarterly Statements, Shareholder Letter
Fixed Costs: Chegg