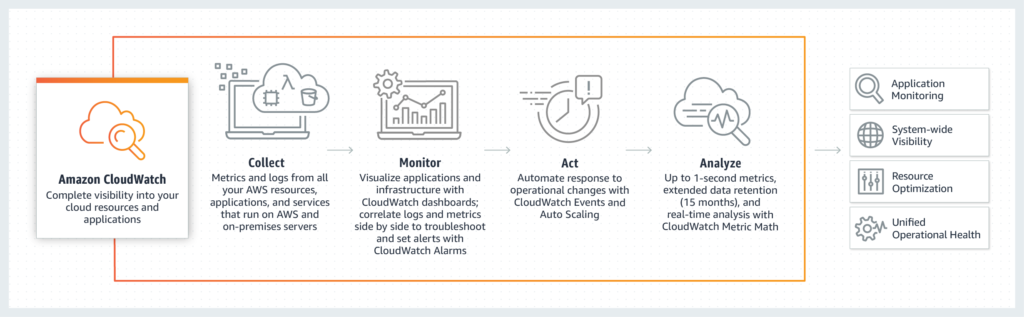
Amazon CloudWatch is a metrics repository that allows users to monitor Amazon Web Services (AWS) resources and applications in real-time.
CloudWatch records operational data in the form of logs, metrics, and events, giving you single point access to monitor the health of all resources, applications, and services that run on Amazon Web Services.
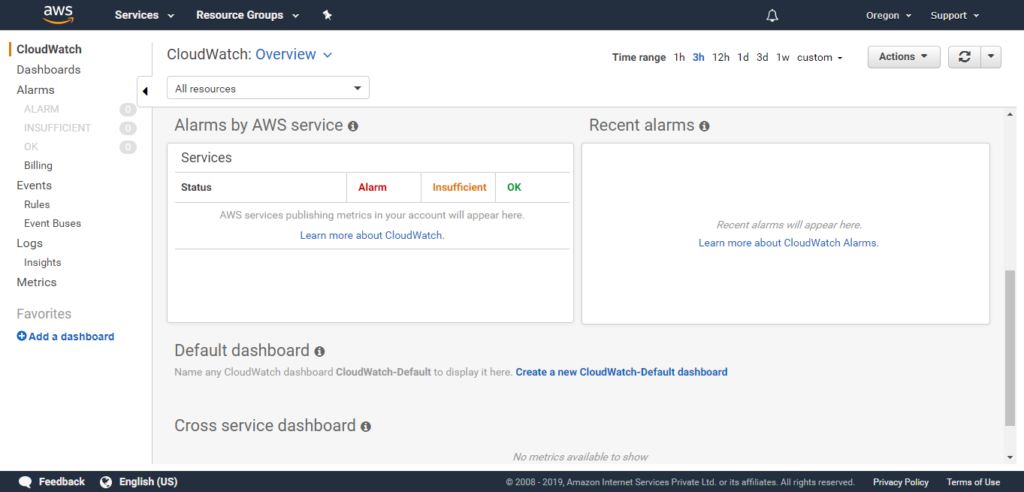
The CloudWatch home page displays metrics about every AWS service that’s in use. Apart from this, users can customize
Who should use Amazon CloudWatch?
Developers, system architects, administrators and managers.
What can you do with Amazon CloudWatch?
-
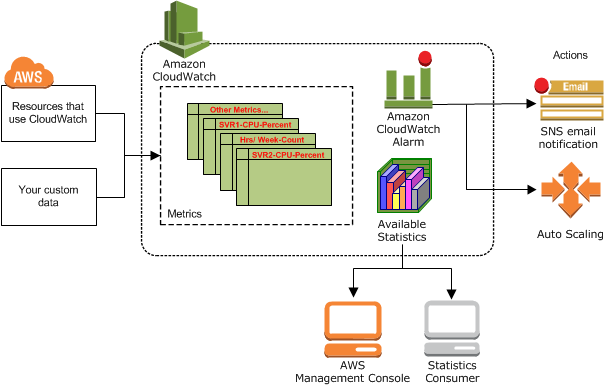
Set alarms on any of your metrics to receive notifications when your metric crosses your specified threshold.
-
Monitor using your existing system, application, and custom log files.
-
Create re-usable dashboards which allow you to monitor your AWS resources in one location.
-
Write rules to indicate which events are of interest to your application and what automated action to take.
Amazon CloudWatch: Sample Use case provided by Amazon
Monitor the CPU usage and disk reads and writes of your Amazon EC2 instances and then use this data to determine whether you should launch additional instances to handle the increased load. You can also use this data to stop under-used instances to save money.
Metrics Retention:
As a resource monitor, CloudWatch collects and retains data. But the granularity (level of detail) of data changes with respect to time.
Metrics, initially published with a shorter time frame are aggregated together for long-term storage.
CloudWatch retains metric data as follows:
-
Data points with a period of less than 60 seconds are available for 3 hours. These data points are high-resolution custom metrics.
-
Data points with a period of 60 seconds (1 minute) are available for 15 days
-
Data points with a period of 300 seconds (5 minute) are available for 63 days
-
Data points with a period of 3600 seconds (1 hour) are available for 455 days (15 months)
Example: If you collect data every minute, the data will be available for 15 days with per minute resolution. After 15 days the data will have a 5-minute resolution and after 63 days the data will have a 1-hour resolution.
Users can store log data indefinitely and access the raw log event data
In November 2018, Amazon launched CloudWatch Log Insights, a fully managed services that can pour over your logs to “give you fast, interactive queries and visualizations“.
Amazon CloudWatch Pricing:
Similar to other Amazon Cloud Services, you pay for what you use and Amazon let’s you get started with CloudWatch for free.
The Free Tier
| Metrics | Basic Monitoring Metrics (at 5-minute frequency),10 Detailed Monitoring Metrics (at |
|---|---|
| Dashboard | 3 Dashboards for up to 50 metrics per month |
| Alarms | 10 Alarm metrics (not applicable to high-resolution alarms) |
| Logs | 5GB Data (ingestion, archive storage, and data scanned by Logs Insights queries) |
| Events | All events except custom events are included |
Please see Amazon CloudWatch pricing page for more details.
If you are using AWS then you must be already using Amazon CloudWatch. If you are not using it, please make use of the free tier to keep a tab on your resources.
Amazon Web Services is one the top three cloud computing providers in 2018. Check out our list of Top Ten Cloud Computing Companies of 2018 and why we think the top half of the list is not going to change in 2019.